If you're anything like me, when I hear the word "data", I immediately feel dread in anticipation of the time it will take to pull out meaningful metrics. Data usually comes in the form of numbers, charts, tables and an overload of analytics. When you work in marketing, you need fast access to data to strategise and make the right decisions for your campaigns and inform clients of their ROI.
We need to know how your digital marketing campaigns are performing in order to adjust our efforts accordingly. Clients also like to be informed and know that their marketing budget is being well spent. Data reports are useful in communicating that but can be very time consuming to collate in a digestible way.
Google Data Studio is a free reporting tool that collates marketing data from online advertising and website performance into an attractive and easy to read dashboard.
Your dashboard is fully customisable and lets you plug in your Google reporting data in a presentation type format. You can also import data from platforms not supported by Google Data Studio. Using third party data connectors, you can import Facebook, Instagram and even Bing Ads data in one place. This keeps your data all contained in one place so you can quickly transform your data into reports for your specific audience.
It completely removes the need for the manual collation of data, allowing you to focus on assessing the data, identifying insights, and developing strategy.
Why Google Data Studio?
Digital marketing data is commonly collected in the application or platform itself, but it can be hard to make neat and digestible reports. Marketers often run multiple reports to collect data from multiple sources, which is tedious work. Google Data Studio cuts that time down dramatically.
When presenting results to clients or staff, the data needs to be broken down and organised, which is not the easiest of tasks. Pulling out relevant parts of a data set for presentation can be super tedious - not something you want to be doing every week.
Google Data Studio allows you to identify which of your marketing efforts are working and which need improvement. You can produce custom branded reports with any of your chosen data sources.
It works automatically by syncing up with your existing Google data, Analytics, Ads and more. In Data Studio, you can create individual dashboards for different data sources, clients or platform types which can then be turned into a report.
The reports are visual and easy to digest if you're presenting to people who aren't as well informed about marketing and how to decipher analytics.
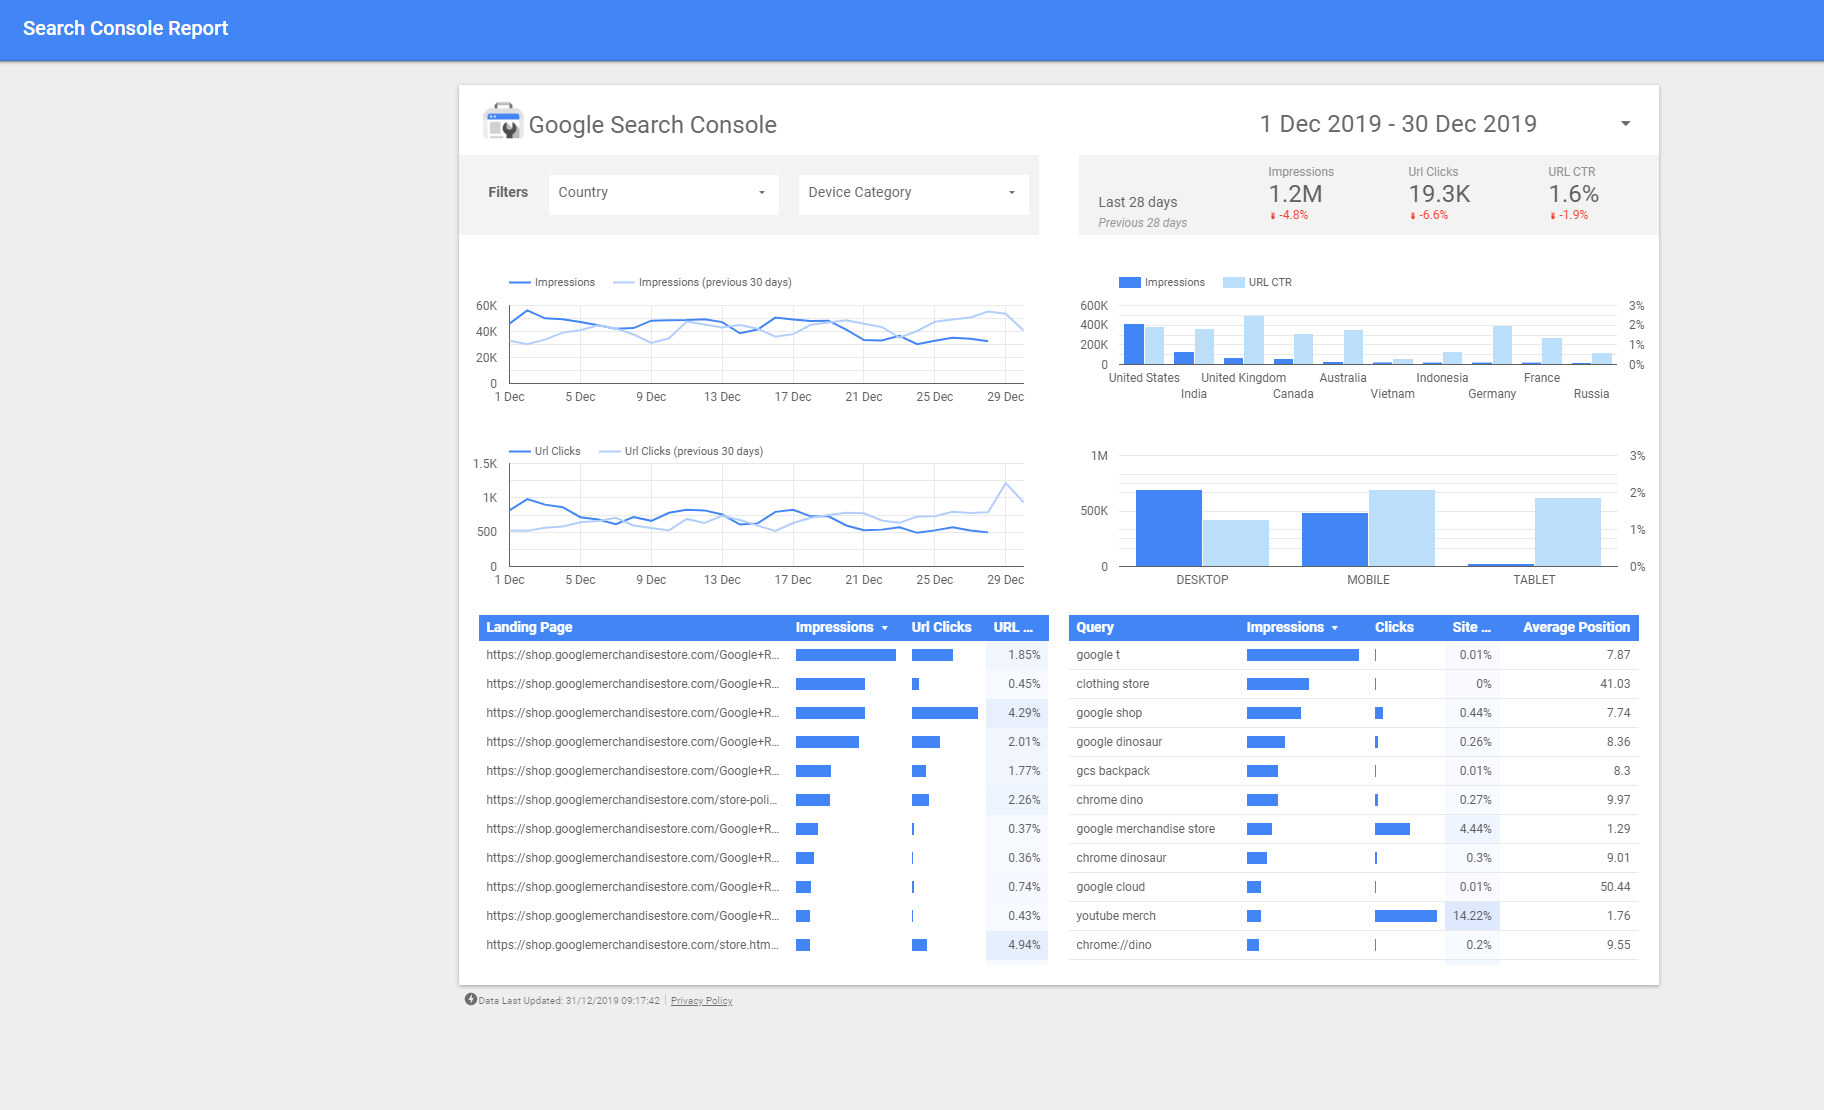
For example, if you were putting together a Google Ads performance report, you might include:
- Impressions and clicks
- Cost Per Click (CPC)
- Click Through Rates (CTR)
- Conversion Rate
- Cost Per Conversion
- Return on Ad Spend (ROAS)
This data can extend to eCommerce performance, so you can see how much online revenue you are generating from different channels.
Any data that can be collated into a Google Sheet can be imported into Data Studio. So even if it's not specific digital marketing data, you can still use it. When it comes time to put it all together, you can create your report. Add your own logo, change fonts and colours and choose how you want your data to be presented in the studio.
If you already have a Google account, you should have no problems accessing Google Data studio. Your existing Google Analytics login should be fine. However, you'll only have access to the beta version. This version allows you to create up to five custom reports before you must upgrade to the full version.
With Google Data Studio's full version, you can import 400+ data sources in one report. This probably isn't entirely necessary, but it's nice to know that you have the option.
How To Use Google Data Studio
Google Data Studio is primarily driven by the user and their goals. Before diving right in, you will probably want to plan out what you want or need to measure depending on your intended audience or advertising objectives. Develop your main KPI's and a few sub-KPI's and then collate the data that caters to them. You may also want to do the basic data studio introduction which can be found in the application.
Once you've done this, you can choose one of the templates that Google has to offer and start creating your report. All of the templates are editable so you can add or take out anything that isn't relevant to your report. You can plan out the look the data you want to include in your report by drawing with a pen and paper to make it easier to visualise the flow.
The main data sources for Google Data Studio are;
- Google Analytics
- Google Search Console
- Google Ads (Google AdWords)
- BigQuery
- YouTube Analytics
- PostgreSQL
- Search Ads 360
- Display & Video 360
If you're using Google Analytics or Search Console, and have more than one subdomain, you will need to set up a data source for each.
To get started, you can use Google's sample data sets so that you can get a feel for what a report should be like. You can select your desired data sources, time dimensions and metrics so that everything is automatically set to follow the same parameters. At this point, you can start playing with your data displays, so your information is as visually stimulating as possible.
In the "connect to data" tab, you'll be able to import a range of different data sources, including anything that you can put into a spreadsheet. Most platforms can download your insights into a spreadsheet, and this can be uploaded into Google Data Studio for reporting.
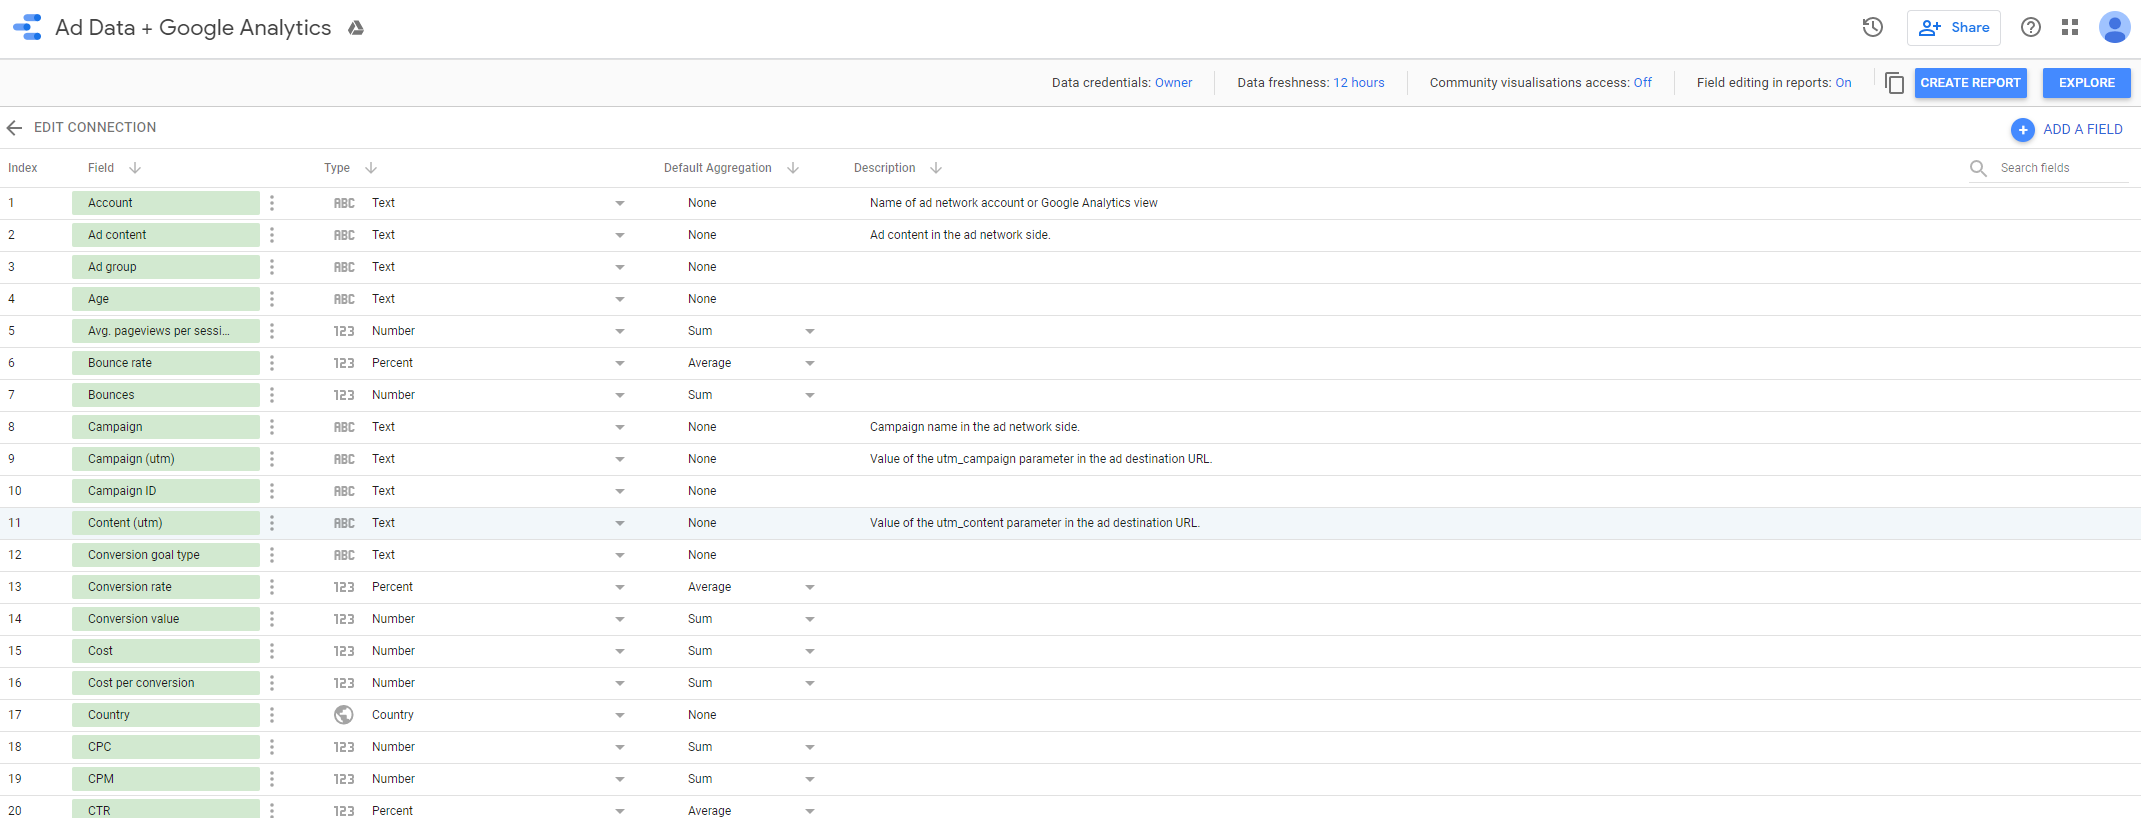
Once you've imported the data you need and selected "connect", you can then create your report and get to editing the data. If you feel that a specific data set, table or graph could use some additional information, but you want to test it first, you can do this in explorer. Unlike data studio, any modifications you make in explorer are temporary, so you can play around as much as you like and not worry about ruining your report.
Get support with Google Data Studio
There is a lot more to Google Data Studio, but it is one of those platforms where the best way to learn is it use it. There are tutorials and samples within the studio to help you become a pro in no time! We suggest starting off with the beta as your testing phase and upgrade when you feel comfortable with the basics of the platform.
If you've read all of this and see the benefits of Google Data Studio, but need help, don't hesitate to handball your data reporting onto us. Book a free exploratory call to find out what we can do to make your business marketing easier.